Gold & Silver's Perfect Storm: Record Prices Amid Global Uncertainties
Gold & Silver's Perfect Storm: Record Prices Amid Global Uncertainties
Expert analysis of converging market forces driving precious metals to historic highs in 2025
Quick Answer: What's Driving the Perfect Storm?
Gold trades at $3,250/oz and silver at $32.50/oz amid an unprecedented convergence of factors: record central bank buying (900+ tonnes annually), the fifth consecutive year of silver supply deficit (215.3 million ounces), Federal Reserve rate cut expectations, geopolitical tensions, and surging industrial demand. The gold-silver ratio at 99:1 suggests significant opportunity, while unusual positive correlations with equities signal a paradigm shift in traditional market relationships.
Table of Contents
- Executive Summary: The Perfect Storm Explained
- Current Market Dashboard & Live Prices
- Historical Context: Lessons from Past Crises
- Market Convergence Factors Analysis
- Advanced Technical Analysis & Patterns
- Central Bank Accumulation Strategies
- Silver's Supply Crisis & Industrial Demand
- Strategic Portfolio Positioning Guide
- Bull & Bear Scenario Analysis
- Frequently Asked Questions
Executive Summary: The Precious Metals Perfect Storm Explained
The precious metals market is experiencing what analysts are calling a "perfect storm" of converging factors that have pushed gold to $3,250 per ounce and silver to $32.50, with both metals showing remarkable strength despite traditional headwinds. This unprecedented situation combines five critical elements:
1. Record Central Bank Buying
Central banks added 244 tonnes in Q1 2025, according to World Gold Council data, marking the strongest start to any year on record.
2. Fifth Year of Silver Deficit
The Silver Institute reports a structural deficit of 215.3 million ounces, driven by solar panel and EV demand.
3. Fed Policy Uncertainty
Markets price just two rate cuts in 2025, creating an environment where gold thrives despite higher yields.
4. Geopolitical Realignment
De-dollarization efforts and trade tensions drive institutional demand for non-currency assets.
5. Correlation Breakdown
Gold's 0.83 correlation with S&P 500 represents a historic shift in traditional relationships.
Understanding these converging forces is crucial for investors navigating today's complex precious metals landscape. For those new to precious metals investing, our comprehensive beginner's guide provides essential foundation knowledge.
Current Market Dashboard: Real-Time Analysis & Key Metrics
As of market close on July 24, 2025, precious metals continue their remarkable performance with gold settling at $3,281.75 (+1.83% daily) and silver at $32.88 (+1.61% daily). These gains came despite a relatively stable dollar index at 100.286, suggesting fundamental demand rather than currency weakness drives current strength. Check live gold prices and current silver prices for real-time updates.
Gold Performance Metrics
YTD Return: +23.4%
52-Week Range: $2,614 - $3,499
ATH (April 22): $3,499.88
Key Support: $3,185
Silver Performance Metrics
YTD Return: +11.5%
52-Week Range: $27.32 - $35.47
1980 ATH: $49.45
Key Resistance: $33.00
Gold-Silver Ratio Analysis
Historical Average: 60:1
5-Year Range: 65:1 - 125:1
Implication: Silver undervalued
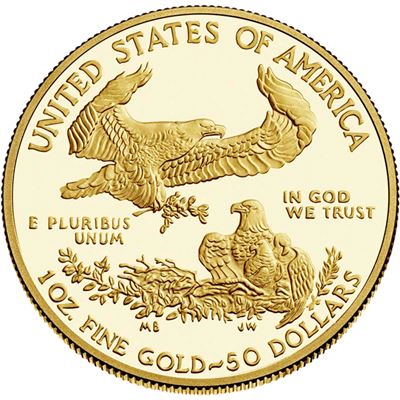
2025 American Gold Eagle - Market Leader
The 2025 American Gold Eagle exemplifies current market dynamics with premiums compressed to just 5.2% despite record demand. The U.S. Mint reports production challenges meeting unprecedented institutional and retail orders, making early 2025 dates particularly sought after.
Why 2025 Eagles Matter:
- ✓ First full year of new reverse design adoption
- ✓ Enhanced anti-counterfeiting features
- ✓ Potential for premium appreciation as vintage
- ✓ Benchmark for global gold liquidity
Trading volumes reveal institutional participation with CME gold futures averaging 27 million ounces daily, while open interest has moderated from April peaks, suggesting profit-taking by early buyers. For deeper insights into current price drivers, explore our analysis of Federal Reserve policies impacting gold prices.
Historical Performance Analysis: Learning from Past Market Crises
Understanding how gold and silver performed during previous economic disruptions provides crucial context for today's market. Our comprehensive 50-year analysis of gold prices through major events reveals consistent patterns that inform current positioning.
Crisis Performance Comparison
| Crisis Period | Gold Performance | Silver Performance | Key Catalyst | Duration |
|---|---|---|---|---|
| 1970s Stagflation | +2,300% (decade) | +2,900% (decade) | Nixon Shock/Oil Crisis | 10 years |
| 2008 Financial Crisis | +180% (2008-2011) | +440% (2008-2011) | Banking collapse/QE | 3 years |
| 2020 Pandemic | +40% (Mar-Aug) | +140% (Mar-Aug) | Monetary expansion | 6 months |
| 2024-25 Rally | +28% (ongoing) | +22% (ongoing) | Multiple factors | Ongoing |
The current rally shares characteristics with the 1970s stagflation period: persistent inflation, geopolitical tensions, and currency debasement concerns. However, today's central bank gold accumulation far exceeds any historical precedent, as detailed in the World Gold Council's latest data.
📊 Key Historical Insights
- Pattern Recognition: Major gold rallies typically last 3-4 years with 150-300% gains
- Silver Leverage: Silver consistently outperforms gold by 2-3x in bull markets
- Correction Patterns: 20-30% pullbacks are normal within secular bull trends
- Central Bank Behavior: Previous accumulation cycles preceded major repricing events
Precious Metals Market Convergence: Understanding the Five Pillars
1. Institutional Demand Surge: Beyond Traditional Patterns
Central bank gold purchases have fundamentally altered market dynamics. According to IMF data, official sector buying reached 1,136 tonnes in 2022 and 1,037 tonnes in 2023, with 2025 on pace to exceed both years. This represents a structural shift from the 450-tonne annual average of the previous decade.
Key central bank buyers include:
- China: Adding 27 tonnes monthly (unreported reserves likely higher)
- Turkey: 165 tonnes added since 2023
- India: Record 38.5 tonnes in Q1 2025
- Poland: Doubled reserves to 420 tonnes
- Singapore: First purchases in decades
For detailed analysis of this trend, see our report on central bank gold purchasing strategies.
2. Economic Uncertainty Drivers
The macroeconomic backdrop creates ideal conditions for precious metals appreciation:
GDP Contraction
Q1 2025 saw -0.3% growth, the first contraction since 2020, according to Bureau of Economic Analysis data.
Inflation Persistence
Despite Fed efforts, core PCE remains at 2.8%, well above the 2% target per Federal Reserve statistics.
Debt Dynamics
U.S. national debt exceeded $34.5 trillion with interest payments surpassing defense spending.
Trade Tensions
New tariff implementations affect $850 billion in bilateral trade, disrupting global supply chains.
3. Monetary Policy Divergence
The Federal Reserve faces an impossible trinity: fighting inflation, supporting growth, and maintaining financial stability. Current Fed Fund futures price only two 25bp cuts in 2025, down from six expected in January. This policy uncertainty traditionally favors gold, as explored in our analysis of gold as an inflation hedge.
Advanced Technical Analysis: Decoding Price Patterns & Indicators
Technical analysis reveals both metals maintaining primary uptrends despite recent consolidation. Understanding these patterns helps time entry and exit points effectively. For beginners, our guide to reading gold price charts provides essential background.
Gold Technical Profile
Fibonacci Retracement Analysis
Gold's correction from the $3,499.88 all-time high has found support at the 38.2% Fibonacci level ($3,186), a classically bullish signal. The next support levels:
- 50% Retracement: $3,057 (December low to April high)
- 61.8% Retracement: $2,928 (major support zone)
- Extension Target: $3,842 (161.8% extension if ATH broken)
Bull Flag Formation
Gold's current consolidation forms a textbook bull flag pattern:
- Flagpole: $2,614 to $3,499 (+33.8% move)
- Flag: Sideways consolidation $3,185-$3,285
- Measured Target: $4,170 (flagpole added to breakout)
- Volume: Declining during consolidation (bullish)
Key Technical Indicators
| Indicator | Gold Reading | Signal | Interpretation |
|---|---|---|---|
| RSI (14) | 54.38 | Neutral | Room for upside momentum |
| MACD | -4.2 | Bearish | Short-term weakness, flattening |
| Stochastics | 62/58 | Neutral | Neither overbought nor oversold |
| ADX | 31.5 | Strong trend | Uptrend strength confirmed |
| 50-DMA | $3,151 | Support | Price 4.1% above average |
| 200-DMA | $2,754 | Major support | Price 19.2% above average |
Silver Technical Analysis
Silver displays an ascending triangle pattern with resistance at $33.00, suggesting an imminent breakout. For detailed silver chart analysis, see our complete silver trading guide.
Ascending Triangle Breakdown
- Base Formation: $27.50 (October 2024 low)
- Resistance Line: Horizontal at $33.00
- Support Line: Rising trendline from $27.50
- Breakout Target: $38.50 (triangle height added)
- Stop Loss: Below $31.50 (triangle support)
Central Bank Accumulation Strategies: Following Smart Money
Central banks' gold accumulation represents the most significant shift in official sector behavior since the end of Bretton Woods. Understanding their motivations reveals long-term price direction. Our analysis of central banks preparing for monetary reset explores deeper implications.
Motivations Behind Record Buying
1. De-dollarization
BRICS nations actively reduce USD reserves, with gold filling the gap. Russia and China lead with 25% and 4.3% of reserves in gold respectively.
2. Sanctions Protection
Physical gold held domestically cannot be frozen or seized, unlike foreign currency reserves or bonds.
3. Monetary Insurance
Gold provides optionality for potential currency resets or new monetary systems, as suggested by recent BIS working papers.
4. Revaluation Potential
Many analysts suggest official gold prices significantly undervalue reserves, with revaluation offering balance sheet relief.
Notably, central banks have begun accumulating silver for the first time in decades, as detailed in our report on Russia's strategic silver purchases.
Silver's Supply Deficit: Industrial Demand Meets Investment Surge
Silver faces the most bullish fundamental setup in decades with the Silver Institute confirming the fifth consecutive annual deficit. Understanding these dynamics is crucial for investors, as explored in our comprehensive silver investment guide.
Demand Drivers Creating the Perfect Storm
Solar Panel Manufacturing
193.5 million oz (2024)
Expected to reach 225 million oz by 2026 as solar installations accelerate globally. Each panel requires 20 grams of silver with no viable substitute at scale.
Electric Vehicle Production
80 million oz (2024)
EVs use 2-3x more silver than traditional vehicles. With 30% annual growth, automotive demand could reach 120 million oz by 2027.
5G Infrastructure
42 million oz (2024)
5G networks require 10x more silver than 4G due to higher frequency components and increased base station density.
Investment Demand
325.4 million oz (Q1 2025)
Physical investment surged 15% above 5-year average as investors recognize supply constraints.
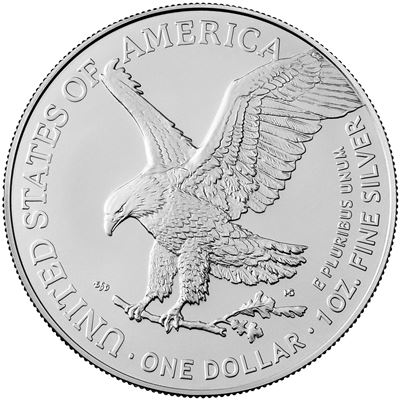
2025 American Silver Eagle - Supply Deficit Beneficiary
The 2025 American Silver Eagle exemplifies silver's supply crisis with the U.S. Mint implementing allocation limits for authorized purchasers. Despite record production attempts, demand continues outpacing supply, supporting premium stability even at elevated price levels.
Investment Highlights:
- ✓ Benefits directly from industrial shortage
- ✓ Government-backed purity and weight
- ✓ Most liquid silver investment globally
- ✓ IRA-eligible for retirement accounts
Supply Constraints Intensifying
Mine production faces significant headwinds:
- Primary Silver Mines: Only 28% of supply, making silver dependent on base metal mining
- Ore Grade Decline: Average grades fell 38% over the past decade
- Capital Constraints: New mine development requires $15+ silver to justify investment
- Geopolitical Risk: Major producers (Mexico, Peru, China) face political uncertainty
For deeper analysis of silver's unique position, explore our comparison of silver versus gold investment merits.
Strategic Portfolio Positioning: Navigating the Perfect Storm
The convergence of factors creating this "perfect storm" demands thoughtful portfolio construction. Our portfolio allocation guide provides detailed frameworks, while this section focuses on current market applications.
Recommended Allocation Strategies
Conservative Approach (Capital Preservation)
Focus on wealth preservation with 25% total precious metals allocation, favoring gold's stability.
Balanced Approach (Growth with Protection)
Maintains growth potential while hedging systematic risks with 20% precious metals.
Aggressive Approach (Maximum Opportunity)
Leverages silver's volatility for returns while maintaining gold as portfolio anchor.
Implementation Tactics
Dollar-Cost Averaging Schedule
Given elevated prices and volatility, systematic accumulation reduces timing risk:
- Monthly purchases: 60% gold, 40% silver during normal conditions
- Rebalancing triggers: Adjust when allocations drift 5% from targets
- Opportunistic buying: Increase purchases on 5%+ daily declines
Gold-Silver Ratio Trading
The current 99:1 ratio presents a historic opportunity. Learn more about this strategy in our complete ratio trading guide:
- Current Action: Exchange gold for silver above 95:1
- Target: Reverse trade when ratio reaches 70:1
- Historical Success: This strategy added 40% to holdings over past decade
Risk Assessment: Bull & Bear Scenario Analysis
Understanding potential outcomes helps position portfolios appropriately. These scenarios incorporate technical targets, fundamental drivers, and historical precedents.
Bull Case Scenario (60% Probability)
Catalysts
- Fed cuts rates 100bp+ as recession deepens
- Central banks accelerate gold purchases to 1,500 tonnes annually
- Dollar index breaks below 95
- Geopolitical tensions escalate further
Price Targets
- Gold: $4,000-4,500 (Q2 2026)
- Silver: $45-55 (Q2 2026)
- Ratio: Compresses to 75:1
Base Case Scenario (30% Probability)
Conditions
- Gradual economic slowdown without crisis
- Central banks maintain steady accumulation
- Inflation moderates to 3% range
- Geopolitical tensions remain elevated but stable
Price Targets
- Gold: $3,400-3,700 (Q4 2025)
- Silver: $35-40 (Q4 2025)
- Ratio: 85-90:1
Bear Case Scenario (10% Probability)
Risk Factors
- Fed maintains restrictive policy through 2026
- Peace agreements reduce safe-haven demand
- Dollar strengthens above 110
- Crypto adoption accelerates as "digital gold"
Price Targets
- Gold: $2,800-3,000 (correction zone)
- Silver: $26-29 (support zone)
- Ratio: Expands to 105-110:1
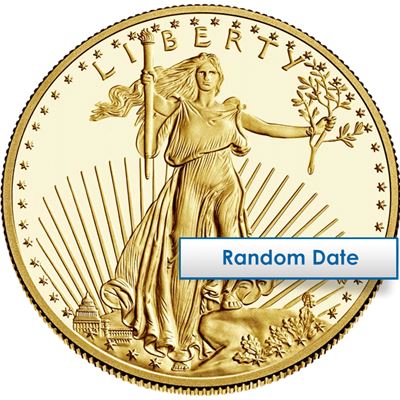
American Gold Eagle (Random Year) - Time-Tested Stability
For investors seeking proven stability through market cycles, American Gold Eagles from random years offer the optimal combination of lower premiums and guaranteed liquidity. These coins have weathered every market condition since 1986, maintaining their position as the world's most traded gold bullion coin.
Strategic Advantages:
- ✓ Lower premiums than current-year coins
- ✓ Identical gold content and backing
- ✓ Perfect for long-term accumulation
- ✓ Proven performance through multiple cycles
Regardless of scenario, maintaining core precious metals positions provides portfolio insurance. For those considering different investment vehicles, our analysis of gold bars versus coins helps optimize holdings.
Frequently Asked Questions About the Precious Metals Perfect Storm
Most financial advisors recommend 5-20% precious metals allocation, but current conditions may warrant the higher end. Conservative investors might target 15-20% split between gold (12-15%) and silver (3-5%). More aggressive investors could allocate up to 25%, with equal weighting between metals. Consider your risk tolerance, investment timeline, and overall portfolio composition. Our detailed allocation guide provides personalized frameworks.
Start with gold for stability, then add silver for growth potential. Gold offers lower volatility and better wealth preservation, making it ideal for beginners. Once you're comfortable, silver's industrial demand and supply deficit create compelling opportunities. The current 99:1 gold-silver ratio suggests silver is undervalued, but its 2-3x higher volatility requires stronger risk tolerance. Consider starting with 80% gold, 20% silver, then adjusting based on experience. See our beginner's guide for step-by-step instructions.
Central bank buying creates a persistent bid under the market, establishing price floors and reducing downside risk. When central banks purchase 1,000+ tonnes annually, they remove significant supply from the market, supporting prices even during retail selling. This institutional demand provides confidence for individual investors and often precedes major price moves. Historical data shows retail investors benefit most by following central bank accumulation patterns. Our central bank tracking guide explains how to monitor these flows.
The gold-silver ratio reflects relative value between the metals, historically averaging 60:1 but currently at 99:1. This ratio fluctuates based on industrial demand (favoring silver), safe-haven flows (favoring gold), and mining economics. Extreme readings create trading opportunities - buy silver when ratio exceeds 80:1, switch to gold below 50:1. The current elevated ratio suggests significant silver upside potential. Learn the complete strategy in our ratio trading guide.
In the current environment, coins offer advantages despite slightly higher premiums. Government-backed coins like American Eagles provide better liquidity, easier authentication, and potential tax advantages. Bars offer lower premiums (2-4% vs 4-7%) but may face stricter verification requirements when selling. For investments under 10 ounces, coins are preferable. Larger investors might combine both - coins for liquidity, bars for bulk accumulation. Our comprehensive bars versus coins analysis details all considerations.
Precious metals are taxed as collectibles at 28% for long-term capital gains (holdings over one year), higher than the 15-20% rate for stocks. Short-term gains are taxed as ordinary income. However, coins can be held in self-directed IRAs for tax-deferred growth. Some states impose sales tax on purchases, though many exempt bullion. No reporting is required for most purchases, but dealers must report certain sales over $10,000. Consult our precious metals tax guide and your tax advisor for strategies.
Silver's smaller market size ($1.5 trillion vs gold's $15 trillion) amplifies price movements. Industrial demand comprises 50% of silver consumption versus 10% for gold, making silver sensitive to economic cycles. Investment flows have outsized impact - $1 billion entering silver moves prices far more than the same amount in gold. This volatility creates both risk and opportunity, with silver typically outperforming gold 2-3x in bull markets but falling harder in corrections. Understanding these dynamics is crucial for position sizing.
While precise timing is impossible, historical patterns suggest this bull market could extend through 2026-2027. Previous cycles lasted 3-4 years with 150-300% gains. Current cycle began in late 2023, suggesting 2-3 years remaining. Watch for these topping signals: central banks becoming net sellers, gold-silver ratio below 50:1, mainstream media coverage reaching fever pitch, and mining stocks significantly outperforming metals. Until these appear, the primary trend remains upward. Monitor our market analysis updates for ongoing assessment.
Federal Reserve policy impacts gold through real interest rates (nominal rates minus inflation). When real rates are negative, gold thrives as holding cash loses purchasing power. Current conditions with Fed Funds at 4.25% and inflation at 2.8% create positive but narrowing real rates. Markets expect rate cuts as economy weakens, which historically boosts gold. However, gold's 2024-25 rally despite high rates signals structural changes in demand. Our analysis of Fed policy impacts provides detailed correlations.
Silver's fifth consecutive annual deficit stems from exploding industrial demand meeting constrained mine supply. Solar panels (193.5M oz), EVs (80M oz), and 5G networks (42M oz) drive consumption growth of 5% annually while mine production grows just 1%. The deficit will likely persist through 2030 as green energy transitions accelerate. Primary silver mines provide only 28% of supply, making production dependent on copper/zinc mining. These fundamentals support a structural bull case detailed in our silver investment thesis.
Position Your Portfolio for the Perfect Storm
With gold at $3,281 and silver at $32.88, the convergence of record central bank buying, supply deficits, and macroeconomic uncertainty creates a generational opportunity in precious metals. Whether you're drawn to the stability of 2025 Gold Eagles, the potential of 2025 Silver Eagles, or the proven track record of classic American Gold Eagles, now is the time to act.
Stay informed with real-time gold and silver price updates • Expert guidance available
Disclaimer: This article is for educational purposes only and should not be considered financial advice. Precious metals investments involve risk, and past performance does not guarantee future results. Price targets and probabilities represent analytical opinions, not guarantees. Always conduct thorough research and consult with qualified financial professionals before making investment decisions. Gainesville Coins does not provide tax, legal, or investment advice.